Principal component group predictions
Core Component Group Predictions
Description
SSMCM allows the generation and visualization of Predictions for the entities of Principal Component Groups defined through its management screen. These predictions are generated by Artificial Intelligence algorithms to anticipate the consumption volumetry of cloud services based on the historical inventory stored by SSMCM.
This module is divided into two sections, an area for viewing the history of data and the predictions obtained, and another presenting the management of predictions built or that are in the process of creation.
Access to functionality
There are 2 types of permissions for organization credentials:
PRINCIPAL_COMPONENT_GROUP_FORECAST_READ:principalcomponentgroupforecast:read: allows the use, listing and visualization of Core Component Group Predictions and their graphingPRINCIPAL_COMPONENT_GROUP_FORECAST_WRITE:principalcomponentgroupforecast:write: allows complete management of Core Component Group Predictions
Using functionality
Data exploration
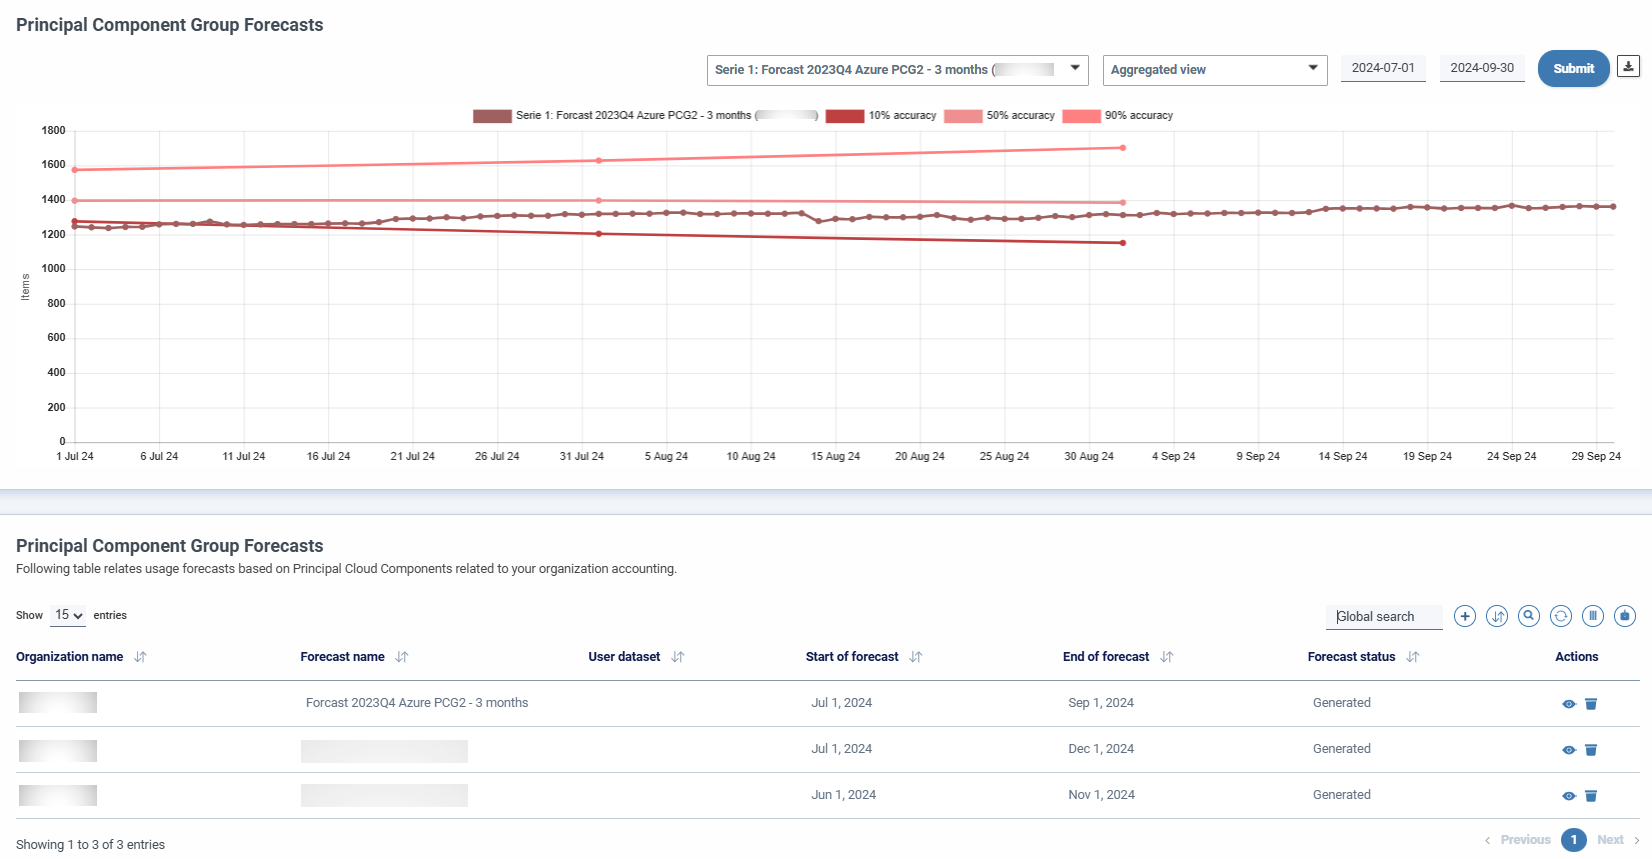
This interactive component allows the user to visually explore and correlate historical data and predictions, supporting different levels of granularity to present information or date ranges.
Things to consider:
- When entering Main Component Group Predictions, a default prediction will be displayed in the graph. This is the most recent series with a status of "Successful." The default date range is the last six months.
- The visualization represents the relationship of historical and future consumption.
- The top controls allow the user to apply different interaction filters:
- Series selector. This selector allows you to choose the series to display:
- It will list all predictions in "Generated" (Succesful) ordered from most recent to oldest of the date of the creation of the prediction. ("Created on" field)
- Allows you to select a maximum of two series.
- By default the last generated series will be selected
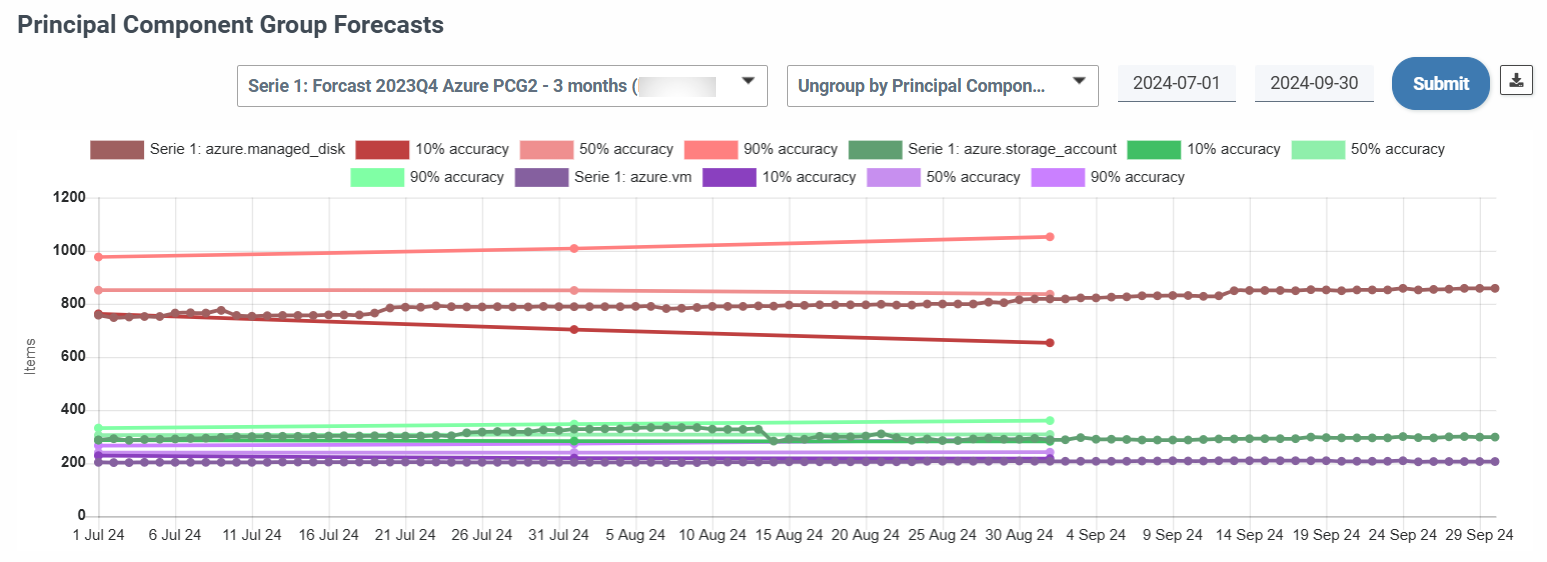
- Display type selector. Determine the perspective of granularity with which the graphs show:
- Aggregate view: It is the total consumption of components By date (day for history, month for prediction)
- Ungrouped by Principal Components: Total aggregate consumption of a given cloud component in the prediction accounts on a date (day for history, month for prediction)
- Ungrouped by Account: Total consumption of all components by one account on a date (day for history, month for prediction) -Dates. Range of dates to display the graph:
- Allows you to select from six months prior to the current date to one year ahead
- By default they include the visualization of the complete prediction.
- If the end date is in the prediction period, it will be corrected until the following month.
- In case of requesting a period where there is no match with the associated prediction, only the historical graph will be displayed.
- In case of requesting a period where there is a coincidence, SSMCM can make corrections in the dates to include in the view the points on which it has generated a prediction closer to the indicated dates.
- Series selector. This selector allows you to choose the series to display:
- Download button of the graphic for export to PNG format
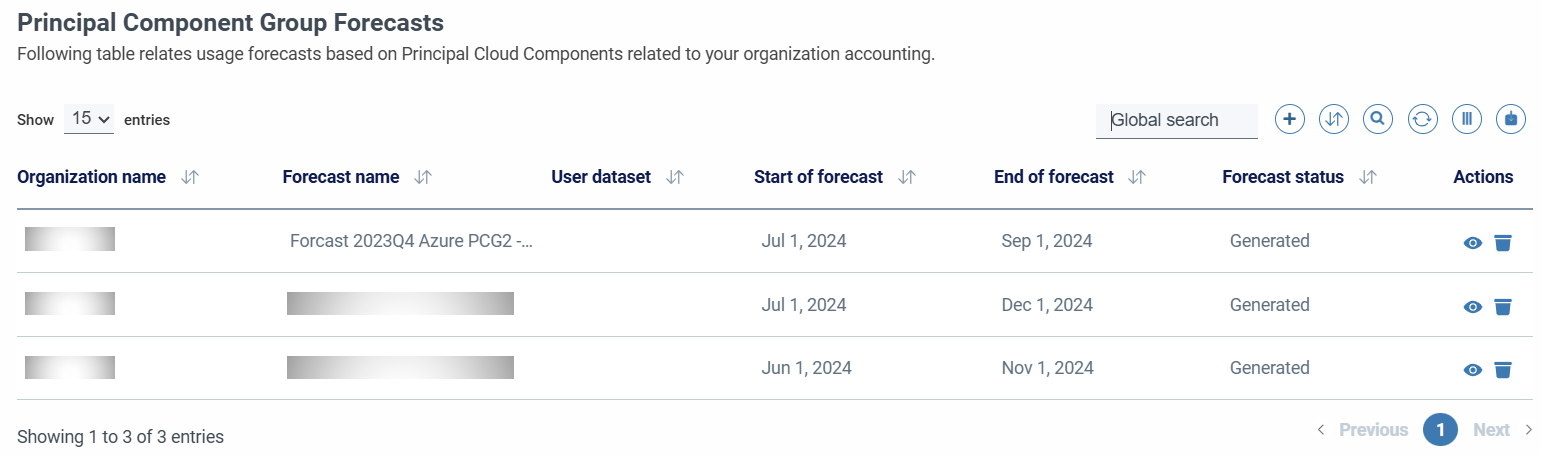
List with all existing predictions
In this area, the Principal Component Group Predictions that have been generated through SSMCM will be managed:
- Displays all predictions sorted by creation date ("Created on" field) in descending form.
- The status of each of the predictions is shown, identifying those that are pending to be generated through the Artificial Intelligence process of those already generated.
- The range of dates between which each of the predictions has been gnered is shown.
- It allows us to access the detailed view where we can find the relationship between accounts and components involved in a certain prediction (the associated Principal Components Group)
Prediction management
In the process of creating a prediction, the following fields must be filled in:
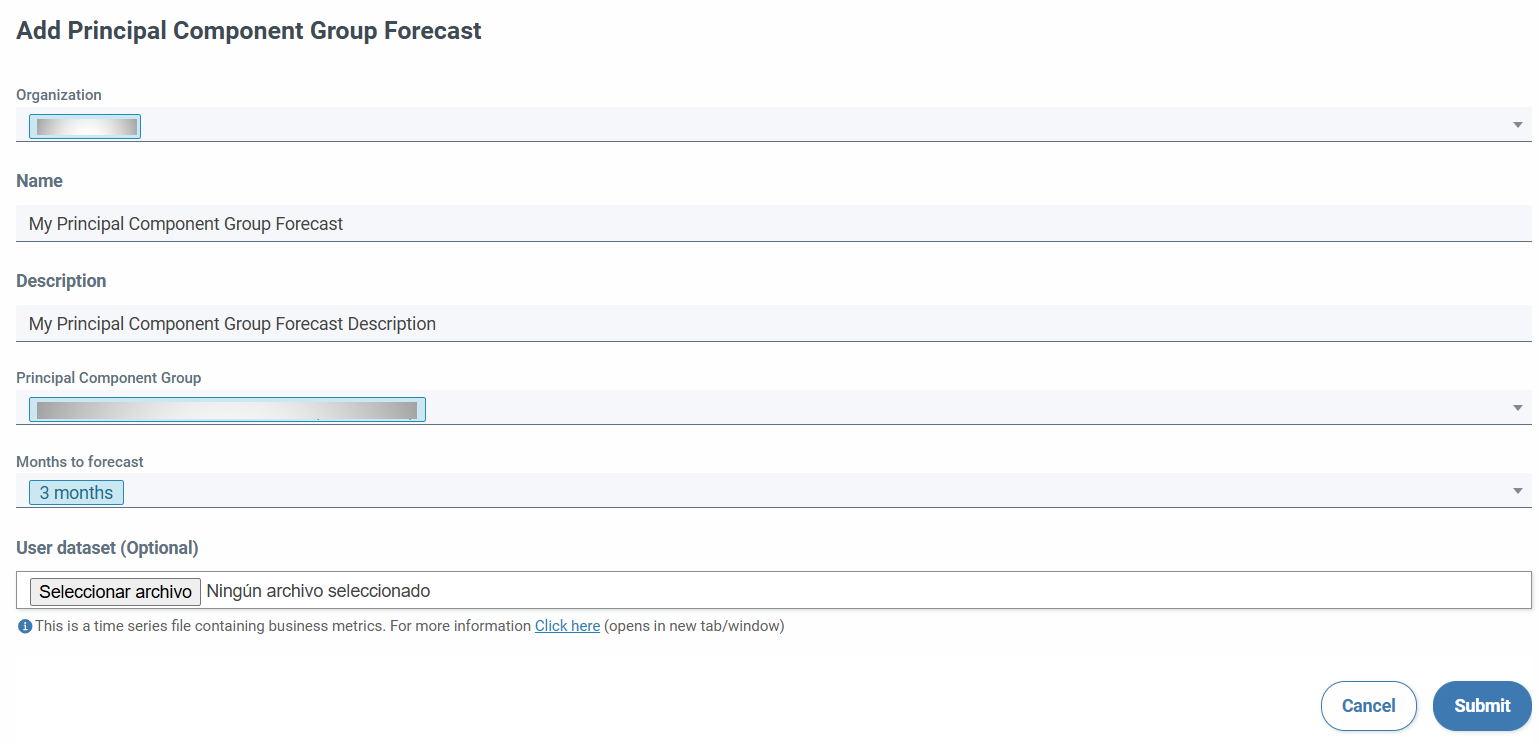
- Organization (required, not editable)
- Name (required. Unique per organization. Non-editable)
- Description (optional. Free text field that allows you to add extra information. Non-editable)
- Main Component Group (required, non-editable)
- Months to predict (The start date will be from the 1st day of the month following the current date. The predictions are monthly and the calculation is stored on day 1 of the corresponding month. Non-editable)
- User Dataset (Optional, non-editable. See the next section for more details)
User Dataset
It is a set of data linked to business indicators, which allow to relate historical factors associated with Business to improve the accuracy of predictions. For example, you can include the aggregate list of visits to websites to help understand the Artificial Intelligence that generates the predictions the stationary factors of the Business layer.
This information is attached as a file in CSV format, exclusively separated by commas, as illustrated below:
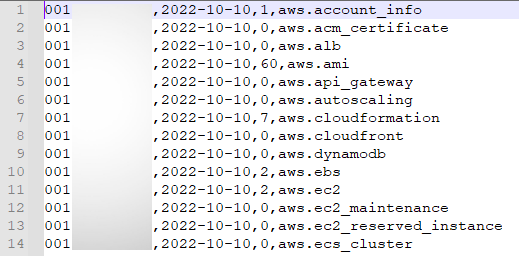
Restrictions. For the process to be generated without errors, it is necessary that the file format follows the following instructions
- The file format must be CSV, separated by commas
- The file must always consist of four columns
- Column 1: Identifier of the cloud account, which must match one of the account identifiers associated with the Principal Components Group on which the prediction is generated
- Column 2: Date, in YYYY-mm-dd format
- Column 3: Unit value of the business indicator, without units. In case of including decimals, the decimal separator must be in period format (Emeplo: 1.80)
- Column 4: Cloud component, which must match one of the cloud service identifiers associated with the Principal Component Group on which the prediction is generated (Supported Cloud Components)
Important aspects to consider for the creation of Predictions:
- A generated prediction cannot be edited.
- When creating a prediction, it will remain in a "PENDING" state during the calculation process by SSMCM.
- The window of the process of calculating a prediction varies, usually it is two to three hours. Once the process is completed correctly, the prediction will be reflected in the "GENERATED" state (SUCESSFUL) and you will be ready to visualize it.
- Predictions are related to the entities of Principal Component Group, This will prevent these entities from being edited or deleted until all the predictions they have linked are deleted.