Trends
Trends
The Trends section displays information about the number of daily trends of vendors and services, showing the total number of items inventoried daily.
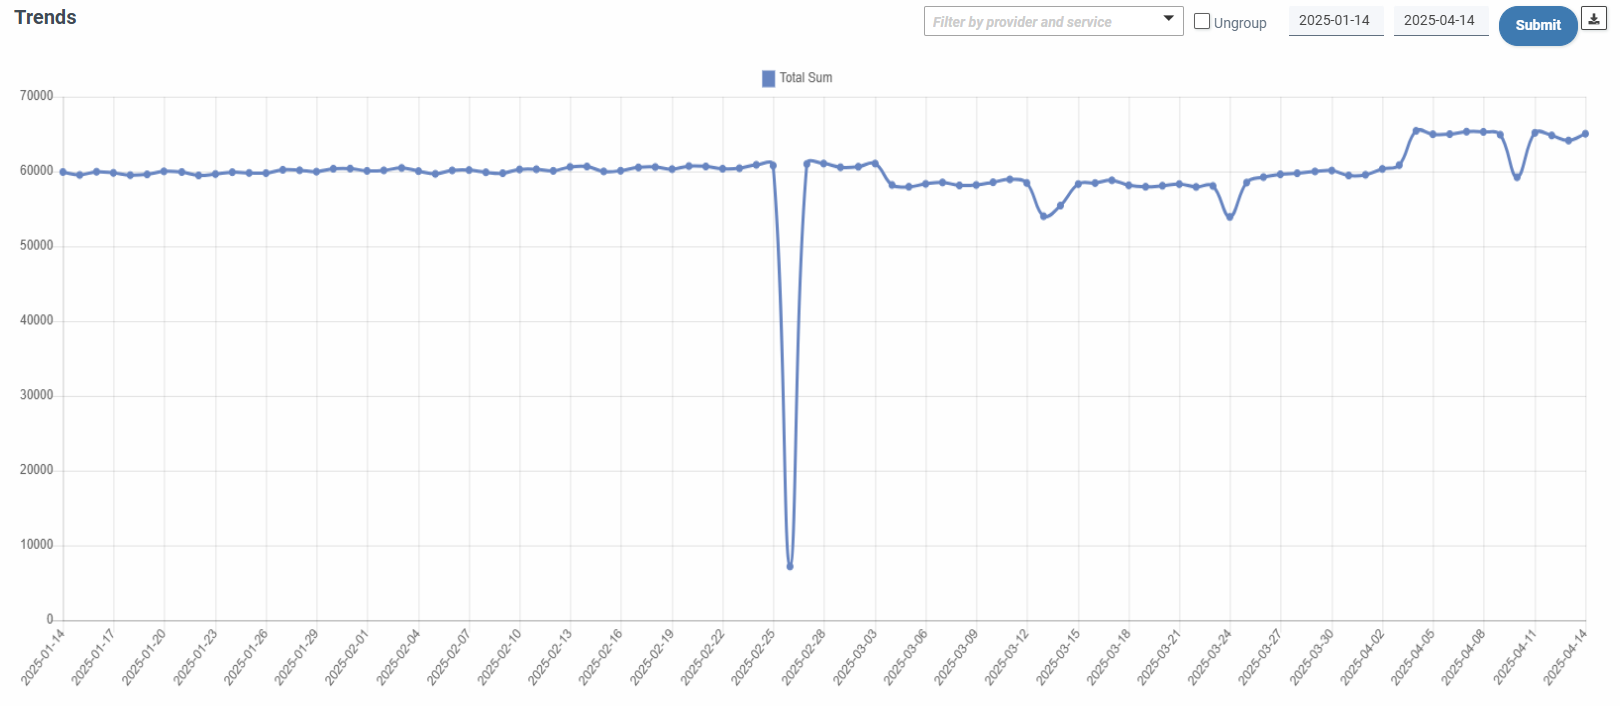
As a general rule, information about the total number of items inventoried per day in the last three months will be displayed. A form in the upper right corner allows:

-
Filter by date range, being the end date of the default interval the current or the last desposable in the database, covering by default the interval the three months prior to the end date.
-
Filter by provider and service, to be able to show even more segmented information of daily trends.
-
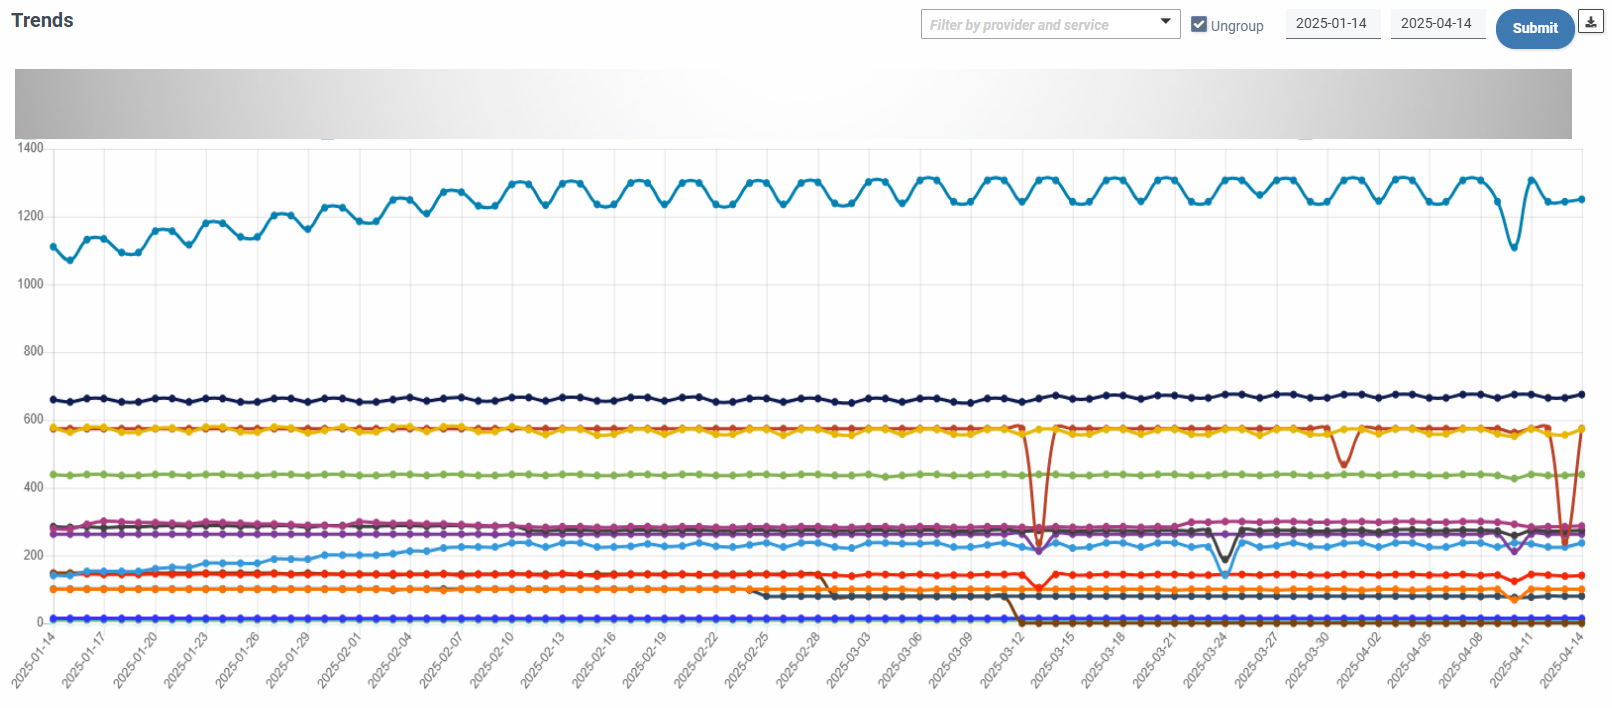
Ungroup, showing a multiline graph with the trends ungrouped by provider and service, being limited to the filter or, if there is no filter, showing the 20 providers and services with the most important figures.
AI Gen Trends Advisor
The AI Gen Trends Advisor section provides insights into monthly increases and decreases in the number of items for specific services or sets of services within an account. It is also capable of detecting organic, non-immediate growth patterns in the infrastructure, particularly those related to ongoing operational efforts.
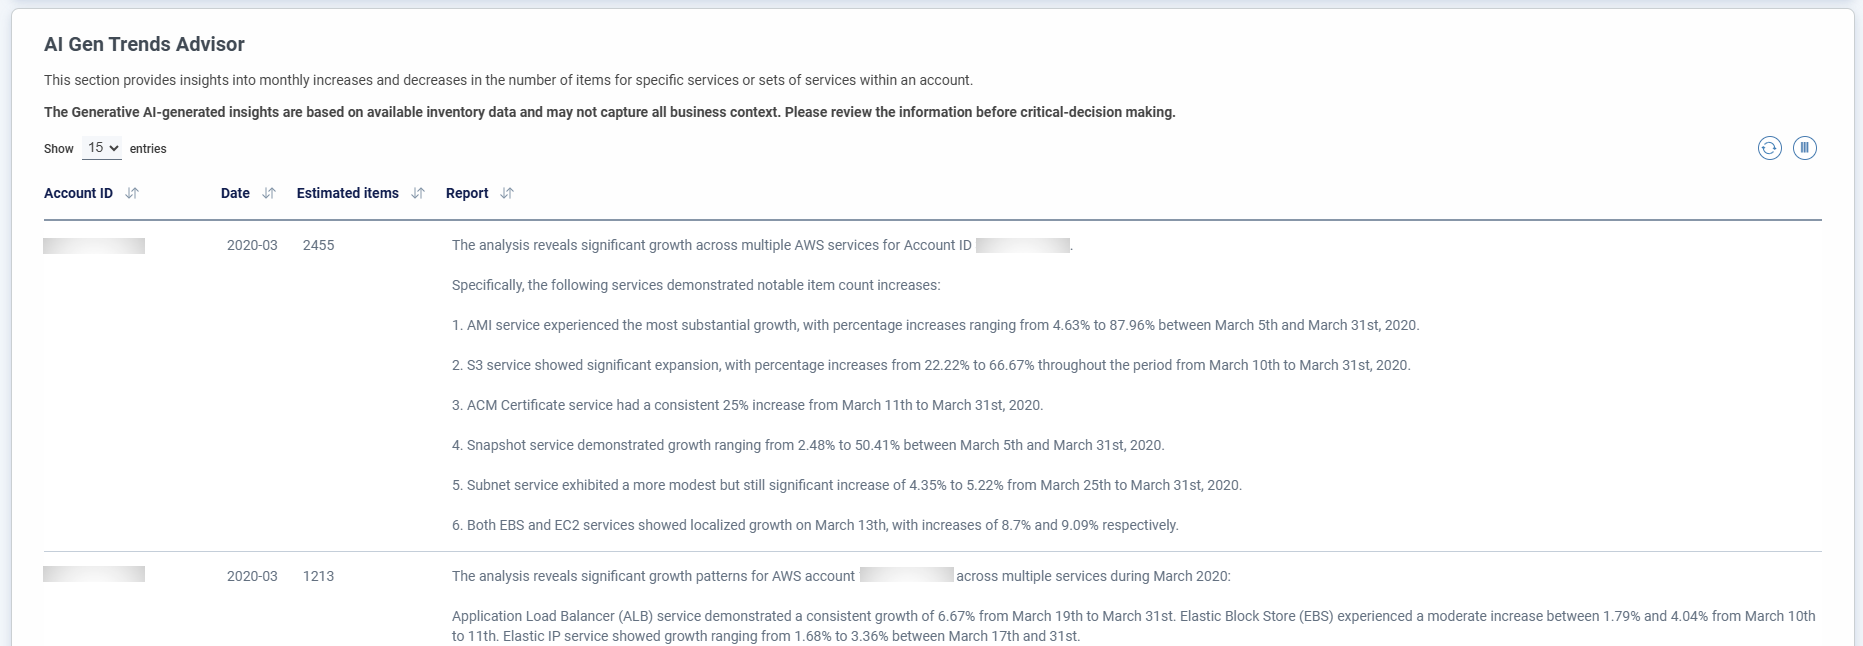
The GenAI-powered trend analyzer allows you to identify deviations in cloud operational management volumetrics in natural language. Based on either a generic or custom algorithm, it can identify patterns of deviation from pre-established thresholds based on natural language instructions on a monthly basis.
If you need to include a specific calculation, please contact product support.
The displayed insights are filtered according to the end date set in the Trends filter.
Note
The AI-generated insights are based on available inventory data and may not capture all business context. Please review the information before critical-decision making.