Statistics
Statistics
The statistics section shows information that is considered relevant by providers and services. Each provider groups the statistics of their services in an accordion menu that can be folded and displayed according to the needs we have.
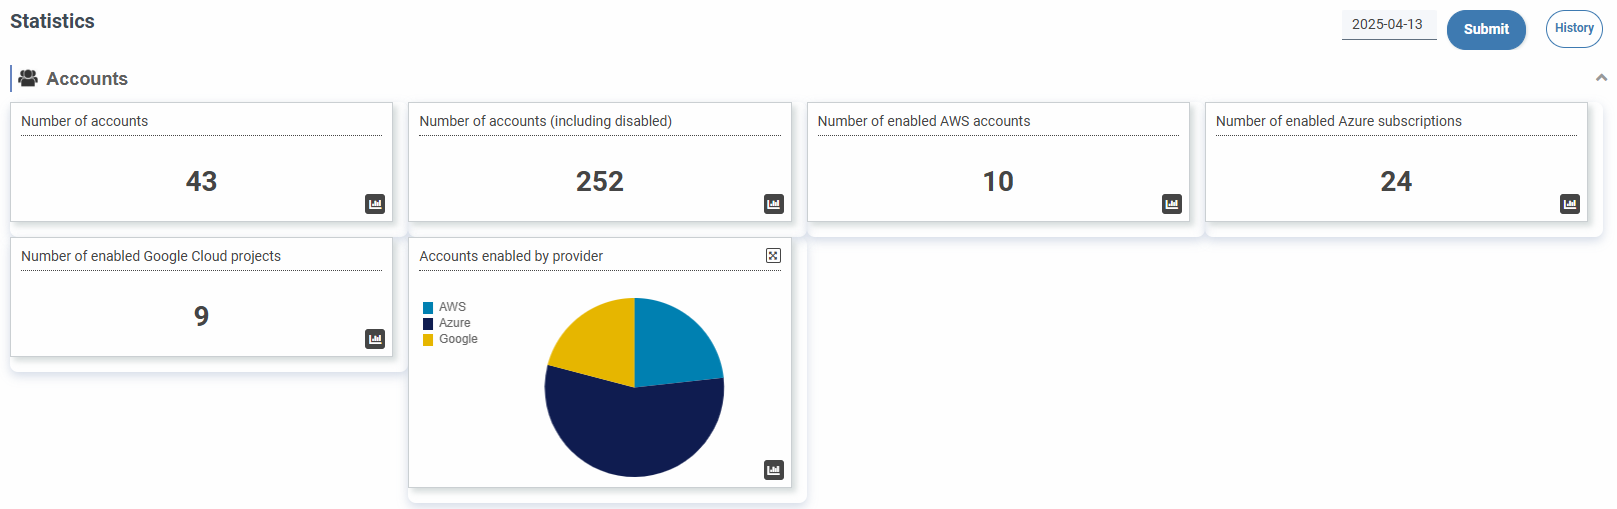
As a general rule, information about the total number of instances of a service will be displayed; and if relevant, the graphical representation of those instances by type, the total space occupied by instances or volumes of that service, etc. will be displayed. The data of each service globally in cards of two types:
- Number cards
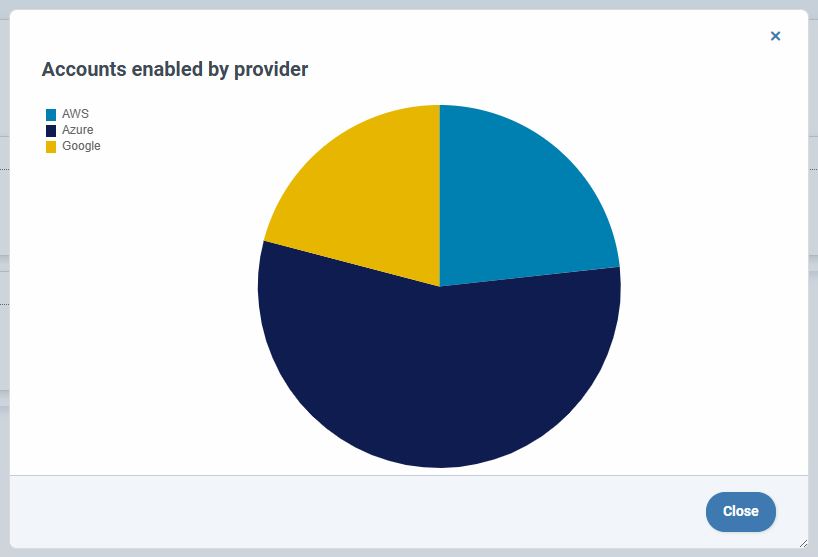
- Cards with sector or bar graphics, in which clicking on the title of the graph will be shown in detail in a modal that we can resize and drag depending on our needs.
A form in the upper right corner allows you to filter by date, with the default date being the current or last available date in the database.
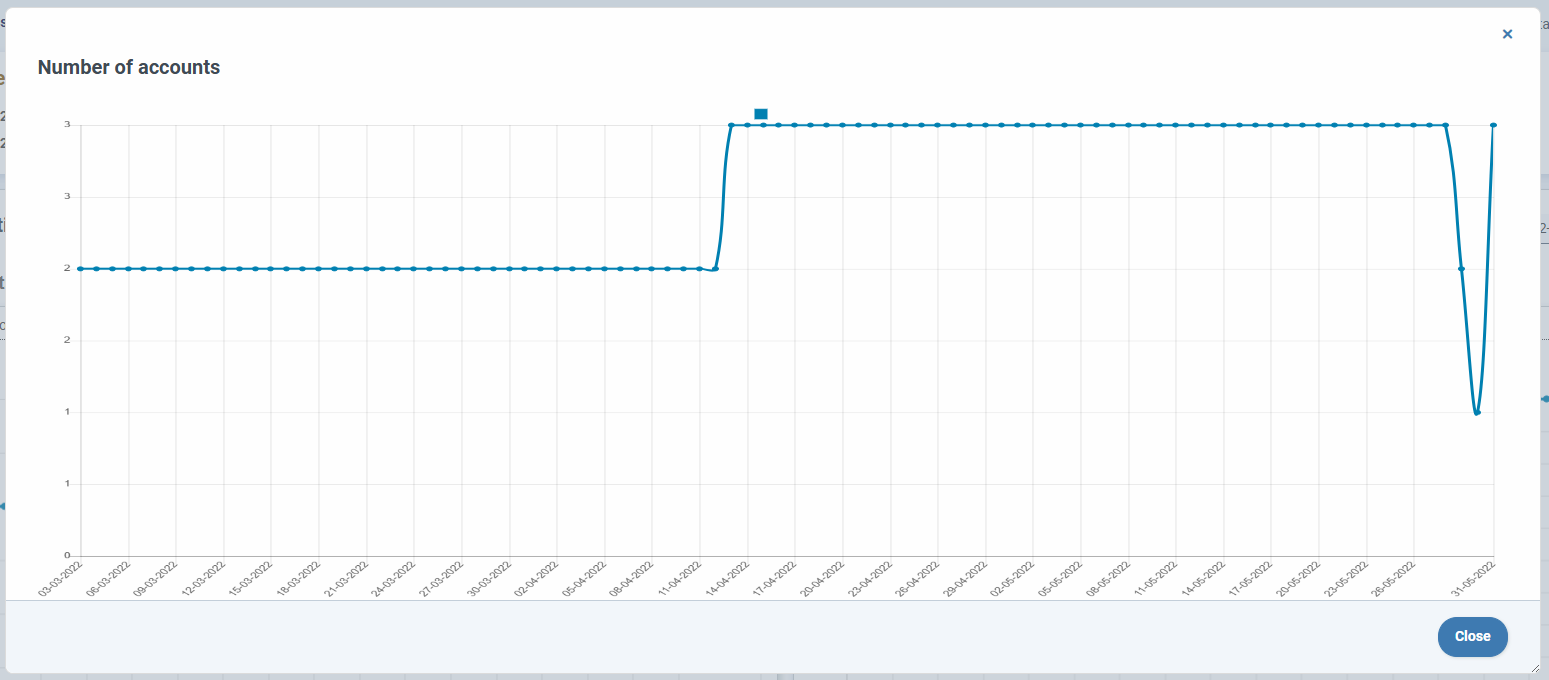
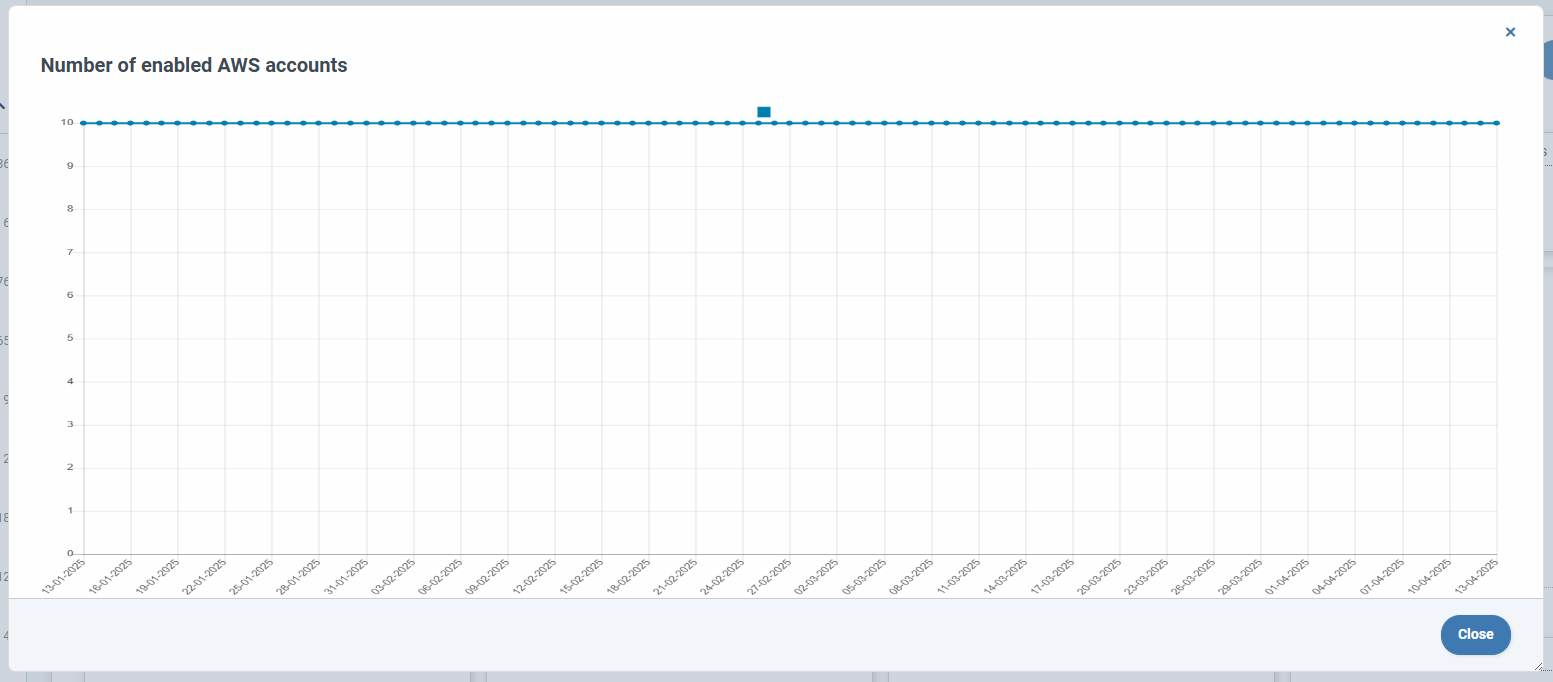
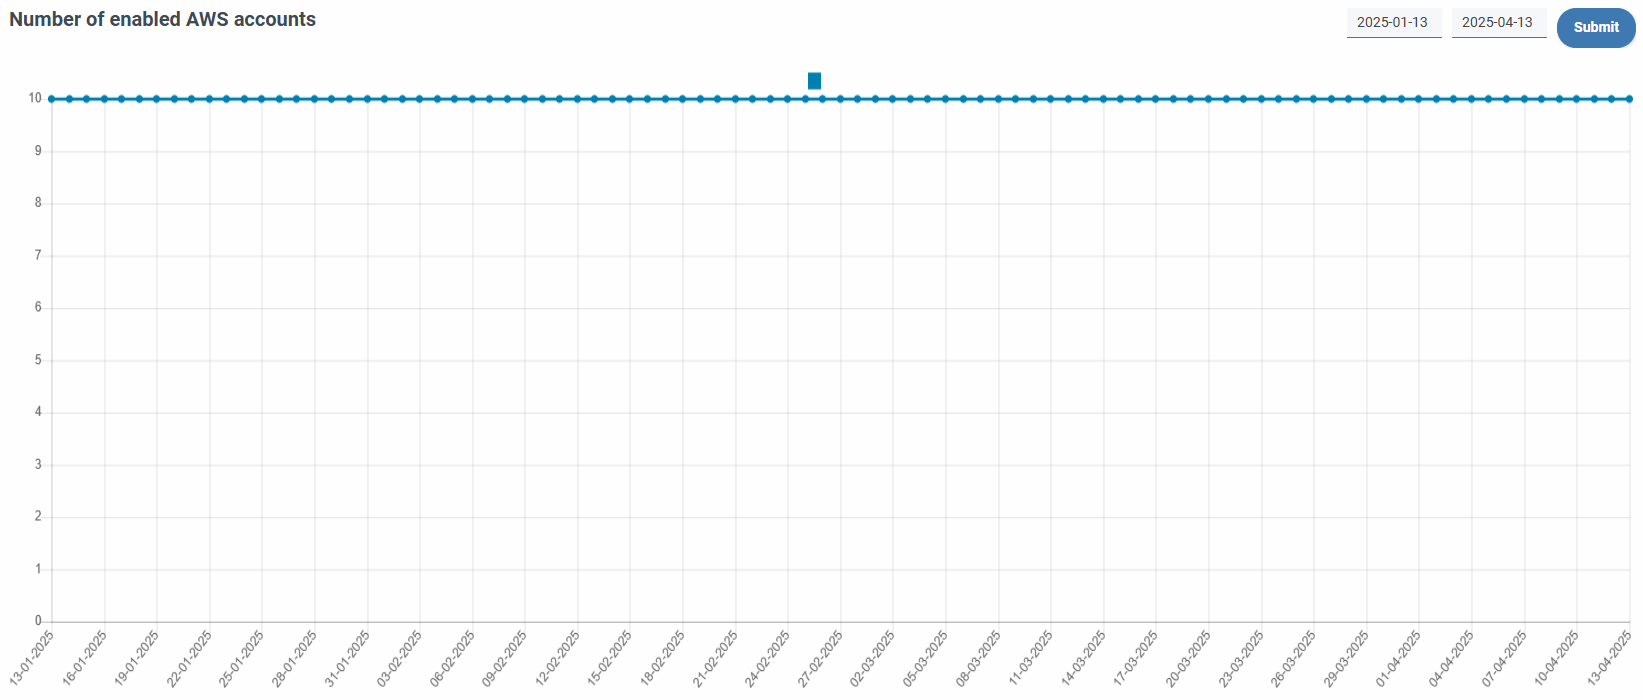
Evolution of a single statistic
Each card has an icon at the bottom right that allows you to show the history of this statistic in two ways:
- In a modal, which we can resize and drag depending on our needs, if we click on the icon with the left mouse button, showing the history of the last three months from the current date or the last date available in the database.
- In a new tab if when positioning ourselves on the icon we click right mouse button and select open in a new tab. This option allows
Evolution of all statistics
If in the statistics section we click on the button next to the filtering form, in the upper right corner, we will access the history with the evolution of all the statistics.
A form in the upper right corner allows you to filter by date range, with the end date of the default interval being the current or the last unpayable in the database, covering by default the interval the three months prior to the end date.
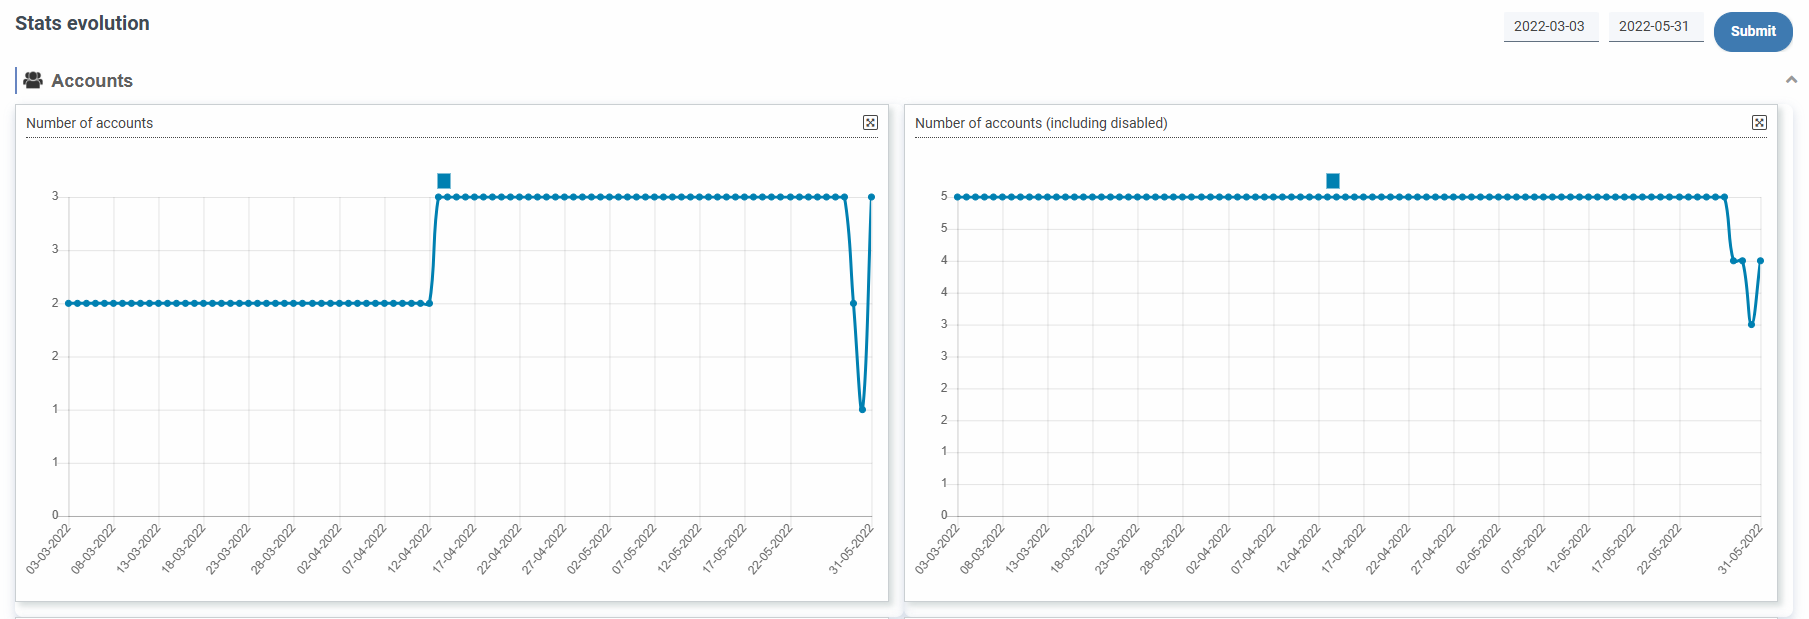
By clicking on the title of the graph it will be shown in detail in a modal that we can resize and drag depending on our needs.